precog: predictive maintenance software
Go beyond monitoring: Automate analysis to take actions
- The PRECOG product can predict the failure of an electric motor two weeks in advance
- Works with DC, single-phase AC, and three-phase AC electric motors that can be part of complex machines
- Enhances operational safety by preventing downtime
- Can predict outcomes based on various physical factors, such as power, current, vibration, temperature, and more…
- Compatible with devices operating indoors or outdoors, whether they use continuous or periodic motion
- Can be used for water and oil pumps, air conditioners, escalators, elevators, production lines, data centers, robotic arms, planers, CNC machines, railway turnouts, etc… essentially any complex equipment that contains an electric motor or electronics where the high availability is crucial
- Precog is a smart maintenance forecasting AI software with over 90% success rate from the start
- Continuously improves as the AI learns and adapts to specific devices
- COST EFFECTIVE: Precog lowers operational costs
- Fully automatic: No regular configuration or technical staff required
- Logistics and maintenance costs can be reduced -> Green solution
Smart maintenance maturity assessment diagram


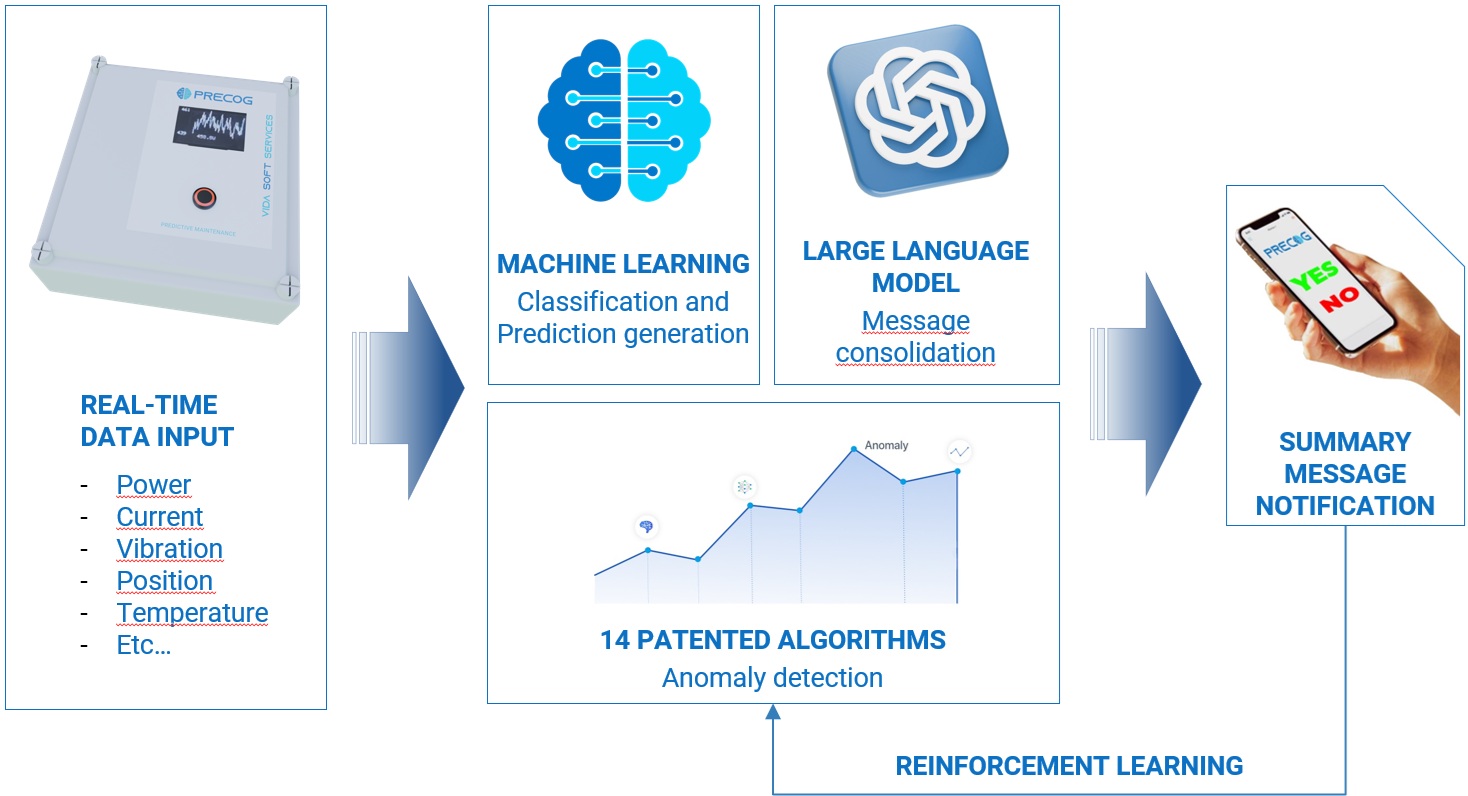
Measuring various physical aspects of IoT devices


Collect and store telemetry data


Monitoring, administration
and general AI
-
Basic fault detection
-
Helps to find the right physical aspects
-
Provide approximate reference data
-
Due to the general model, the success rate is significantly lower


Precog statistical algorithms
-
Designed for industrial use
-
Typically for electric motors and machines performing periodic motion
-
Combines multiple different probability calculation algorithms
-
High success rate, as it is specifically tailored

PRECOG AI
-
Automatically learns the behaviour of the device
-
Development of algorithms tailored to the specific device
-
Continuously improves the efficiency of the algorithms
-
Automatic reference data determination
-
Short learning time
-
Very accurate forecasts, analysis and advice
Telemetry data process

- Precog can be accessed via a web API interface over the internet or on-premises.
- A simple data structure requires just four fields of data to make a prediction.
How PRECOG works
- 14 years of experience
- AI utilizes Recurrent Neural Networks (RNN)
- Precog utilizes 14 distinct probabilistic algorithms
- Trained with more than 7 billion measurement data points
In this example, you can see how Precog raises an alarm 14 days before a fault occurs in an electric motor.
Click here to try the PRECOG Predictive Maintenance Software with real-life examples or by using your own data
Case Studies
Turnout prediction projects in the railway sector
The turnouts use single-phase or three-phase AC electric motors.
Prediction project in the telecommunication industry
Turnout prediction projects in the railway sector
The turnouts use single-phase or three-phase AC electric motors.
Prediction project in the telecommunication industry
Achievements
- 30% reduction in maintenance costs
- 75% reduction in unplanned site visits and false alerts
- 50% improvement in detection rate
- 40% reduction in downtime
- ZERO unplanned maintenance
Accuracy and Evaluation
The algorithms have been tested based on > 1,500 different assets and indicators, using over 10 years of diverse technical measurement data.
The accuracy of the PRECOG algorithms is measured using a custom evaluation and testing program designed for this purpose.
Various technical parameters are continuously evaluated based on criteria including the ones listed below, and we continuously improve the efficiency of the predictions by appropriately adjusting these parameters.
Ways to assess the accuracy of the capabilities of PRECOG prediction algorithms
-
Fault prediction ratio (above 90%):
- We count how many faults the algorithm successfully predicted within a given period, including both the faults that were mitigated in time and those that occurred.
- Formula: Number of correctly predicted faults / sum of faults happened
-
Prediction in time (above 90%):
- PRECOG is reliable in predicting medium and long-term faults, as well as sudden short-term faults.
- Formula: Number of predictions made in time / total number of predictions made
Click here to see examples
-
Critical alerts ratio (~100%):
- Almost all detected faults trigger at least one red alert from PRECOG before they occur, timely warning the operator.
- Formula: Number of red alerts / total number of alerts
-
False critical alerts ratio (less than 1%):
- PRECOG algorithms are designed to minimize false alerts, thereby preventing unnecessary distractions for the operator.
- Formula: Number of false red alerts / total number of alertsalse critical alerts ratio (less than 1%)
-
Consistency of predictions (above 80%):
Other solutions vs PRECOG

Classic Boundary Value & Threshold Detection Methods
Pros:
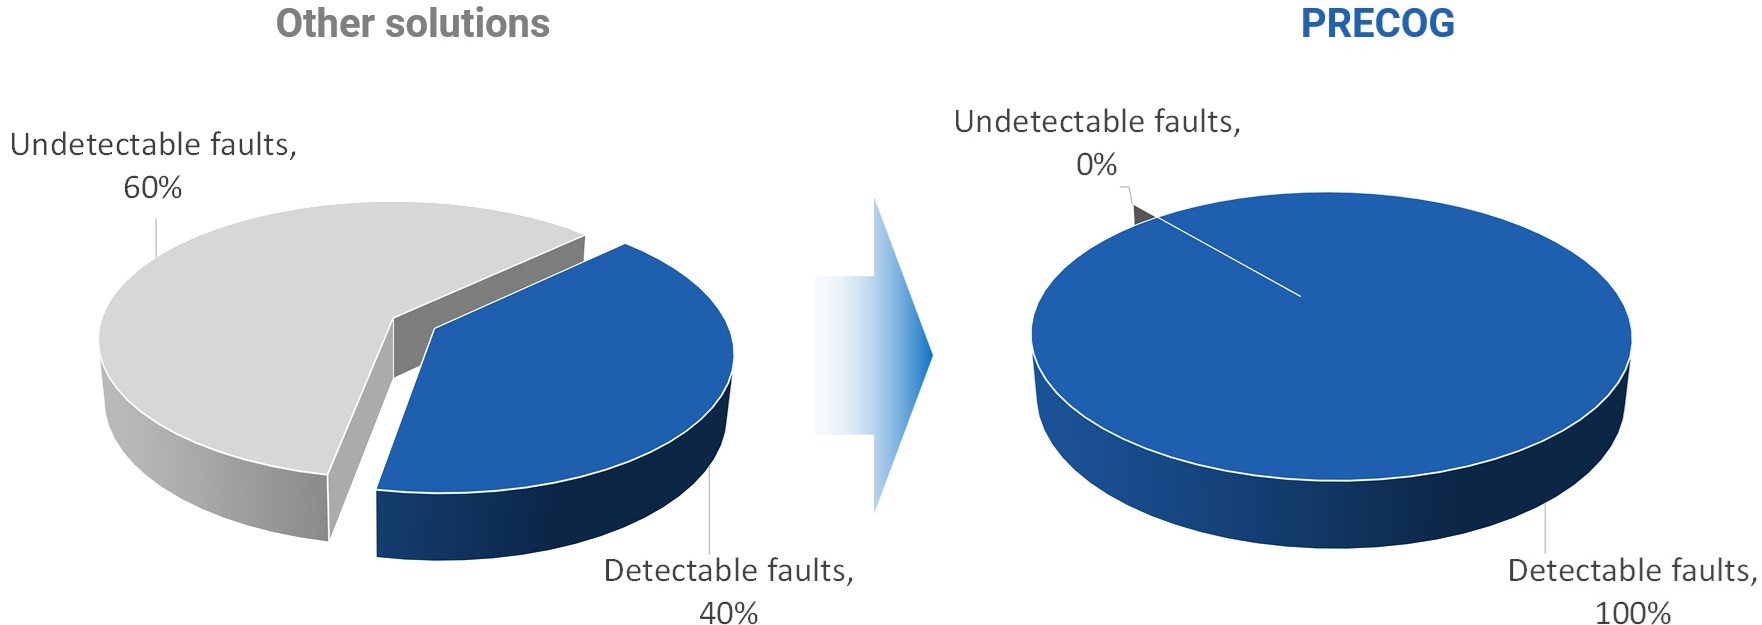
- Effective for Gross Faults: Can detect obvious, significant faults, which typically make up around 40% of all detectable faults.
Click here to see a real life example - Simplicity: This method is straightforward to implement, making it accessible for very basic fault detection needs.
- Easy Maintenance for Similar Machines: Threshold values are easy to maintain when applied to machines of the same type or under similar operating conditions.
Cons:
- Limited Detection Timing: Faults cannot be detected as they emerge, only once a predefined threshold is reached.
- Limited Fault Detection Rate: Only effective for obvious or large faults, cannot identify subtle, nuanced or gradual issues.
- Inability to Detect the Majority of Faults: Cannot detect faults that fall within the machine’s normal operational range or appear as random noise.
- Lack of Adaptability: Cannot adapt to environmental changes, which can reduce the method’s reliability over time and potentially lead to false alarms.
- Challenging to Adapt for Diverse Machine Types: Maintaining threshold values is difficult for machines of different types, models, or in various locations.
- Complexity with Periodic Machines: Splitting threshold values for machines with periodic behavior adds complexity and can lead to inaccurate fault detection.
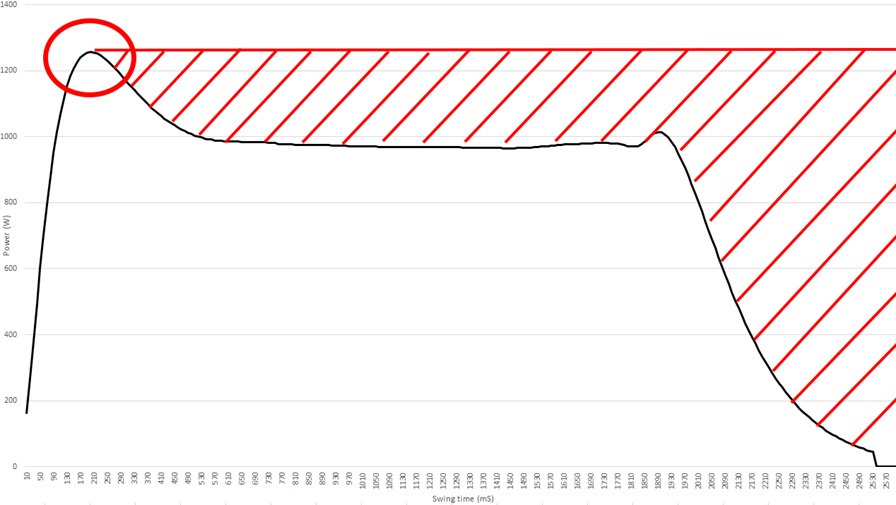
- Limited Detection Points in Periodic Machines: Unable to track variations across all points in the power consumption curve of periodic machines.
- Multiple Errors with Multiple Thresholds: Requires various types of thresholds for different fault types, reducing clarity.
- External Factors and Extra Hardware Requirements: External physical factors, like temperature, weather, or humidity, may need to be measured with additional sensors, increasing the system’s cost and complexity.
- Complex Calculations and Low Success Rate: Calculating and accounting for external factors further complicates the system, often without a significant improvement in fault detection success.
- No Device-Specific Customization: Unable to adapt to the unique operational characteristics of individual devices, limiting the precision of fault detection.
PRECOG
Pros:
- Early Fault Detection: Faults can be detected as they emerge, allowing for proactive intervention before reaching critical thresholds.
- Comprehensive Fault Detection: The system can detect all physically detectable faults, including subtle, nuanced, or gradual faults that other methods might miss.
- Simplicity in Implementation: The method is straightforward to implement, making it easily accessible for complex fault detection needs.
- Broad Fault Detection with One Method: Only one method needs to be implemented. PRECOG can detect faults identifiable by both Classic Boundary Value & Threshold Detection Methods, as well as more complex faults, ensuring comprehensive coverage.
- Ease of Maintenance: Once threshold values are set for the edge operational case, maintenance is minimal—even if similar machines vary or have different operating conditions.
- Advanced Detection in Normal Operational Ranges: The system can detect faults within normal operational ranges or amidst noise, offering an additional layer of protection against abnormal conditions.
- Flexibility Across Machine Types: Easy to maintain threshold values across similar machine types, models, or operating environments, enhancing adaptability to different setups.
- Comprehensive Fault Monitoring: All measurement points are monitored and analyzed, enabling detection of any faults based on where they appear on the power consumption curves. The “Recipe” approach provides flexibility and a wide range of fault assessments.
- Automatic Adaptability: The system automatically adjusts to external or environmental changes, reducing false alarms and often eliminating the need for additional sensors.
- Customization for Specific Device Needs: The AI-driven system can adapt to the unique operational characteristics of individual devices, providing a more tailored and precise fault detection process.
Cons:
- Requires Testing and Data Analysis: Proper testing of devices and thorough data analysis are needed.
- Requires Sufficient Computational Power: The system demands adequate calculation capacity to process and analyze data in real time.
Boundary values & thresholds detection method

Using thresholds and splitting the curve into smaller pieces can lead to better results, but these methods are still not nearly as effective as Precog, which monitors changes at every point on the curve.
