Case Study – Railway industry
What to measure?
Within this railway project, the power consumption (in watts) of 300 turnouts is monitored.
These turnouts perform periodic motions and are powered by single-phase or three-phase AC electric motors.
These complex machines move the heavy railway turnouts either through friction drives or with the help of hydraulic transmission systems.
How to measure?
To measure power consumption, we use current sensor clamps to measure current, and SIL-4 certified voltage measurement devices for voltage.
(Power consumption = Current × Voltage).
Since these devices are critical for life protection, the measurements are performed using SIL-4 certified devices.
Power consumption is measured instead of direct force because the measurement devices can be placed indoors in the relay room, ensuring continuous measurement.
In contrast, direct force measurement devices need to be placed outdoors and are only suitable for temporary measurement.
What is measured?
You can see the power consumption curve of a three-phase electric motor, which moves the switch blade of the turnout.
The electric motor is connected to a hydraulic system that balances the curve, requiring very sensitive measurement devices.
The large machine and the need for high sensitivity introduce significant noise, making it almost impossible to detect issues without Precog, as some fault types fall within the normal curve range.
For instructions on analyzing periodic motion waveforms, please refer to the relevant description here.

Machine learning and data analytics
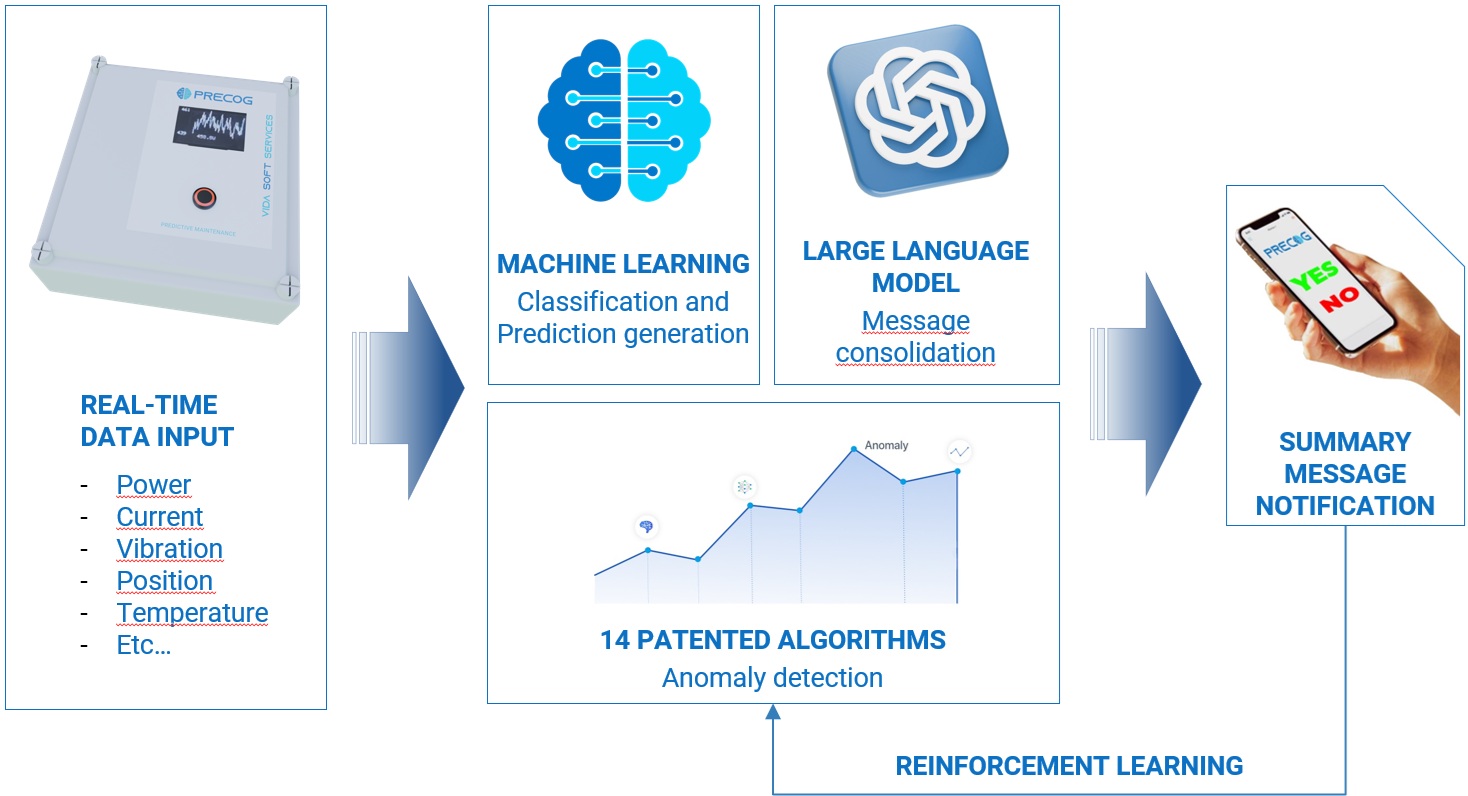
Machine learning algorithms analyze data to detect failure patterns in assets like point machines.
They help select relevant reference curves, reducing noise and improving prediction accuracy.
As more data is collected, confidence in predicting asset behavior and time to failure increases.
Data analytics process large datasets to identify trends and diagnose issues in real time.
This approach helps prioritize repairs, reduce unplanned failures, and optimize maintenance schedules.
Testing
The influence of other physical factors on the turnout can also be important, such as:
- Temperature
- Rain
- Snow
- Other environmental effects
These factors are reflected in the target data, which can be defined by testing the turnout or analyzing long-term data. See more at handling target data here.
Testing possible failures and analyzing the data to understand the physical relationships are crucial for setting up the right strategy when using Precog.
Cost reduction
Shortel logistic chains and smaller storages can be reached with focused maintenance teams.
Optimized asset usage leads to long-term cost savings and improved reliability.
Reduce unplanned failures to cut operational costs and optimize staff deployment.
Intelligent maintenance strategies improve resource allocation and safety.
Remote condition monitoring helps detect failures early and prevent over-maintenance.
Predictive maintenance using data and machine learning reduces downtime and extends asset life.
Green solution because less maintenance leaves a smaller carbon footprint
Exact achievements:
- 30% reduction in maintenance costs
- 75% reduction in unplanned site visits and false alerts
- 50% improvement in detection rate
- 40% reduction in downtime
- ZERO unplanned maintenance
Process telemetry data
The measured values are transferred through an IoT network to the data server, which then calls the Precog server for prediction analysis.
Precog can be accessed via an API solution, with options to store or not store data, and it can be deployed on-premises or in the cloud.
The advantage of storing data is that only the latest data needs to be sent, shortening the end-to-end prediction process time.
Precog follows best practices in safety and data protection to ensure a safe and secure connection.

Case Study – Telecommunication industry
Overview of KPI Utilization
- In the competitive telecommunications landscape, Key Performance Indicators (KPIs) guide operational and strategic decisions.
- The telecommunications company employs 850 different KPIs categorized into distinct areas.
- Each category focuses on specific aspects of performance and technical efficiency.
- This comprehensive approach ensures effective monitoring and enhancement of services.
- Maintaining high service reliability is crucial for success in this industry.
IT Architecture and Operations KPIs
- KPIs related to IT architecture and operations assess the efficiency of IT projects.
- Key metrics include cost variance and resource utilization, ensuring optimal IT performance.
- Monitoring network-related KPIs with “Precog” helps detect issues before they escalate, preventing service outages.
- This proactive approach enhances service reliability, resulting in improved customer satisfaction.
- Additionally, operational KPIs measure critical performance metrics like database availability and incident response times.
Technical Indicators for Hardware Reliability
- “Precog” is also employed to monitor failure KPIs in data centers, helping identify potential hardware component failures.
- By measuring physical clock signals on circuit boards, “Precog” can detect subtle changes that may indicate a malfunction.
- This predictive capability allows for timely interventions, reducing downtime and maintaining operational continuity.
- Monitoring these technical indicators is vital for ensuring the performance and reliability of essential infrastructure.
- Early detection of hardware issues supports the company’s commitment to delivering uninterrupted services.
Integrating KPIs with the Precog
- The diverse array of KPIs feeds into the “Precog” prediction system.
- Excellent results are backed by over 14 years of experience and 7 billion measurement data points.
- The system identifies trends and patterns that inform strategic decision-making.
- Continuous refinement of algorithms leads to more accurate forecasts and improved business outcomes.
- This integration enhances the effectiveness of the “Precog” software solution.
Conclusion: Harnessing Data for Innovation
- The telecommunications company exemplifies the power of comprehensive KPI utilization.
- Focusing on key performance areas drives innovation and operational excellence.
- Integrating these metrics into the “Precog” software solution enhances service delivery and reliability.
- The data-driven approach allows for adaptability in ever-changing technical demands.
- This underscores the capability of “Precog” to work seamlessly with a wide variety of KPIs.


