
How PRECOG evaluates your data
This page explains how PRECOG works with continuous-operation machines such as hydro and oil pumps, electric car engines and other smoothly running electric motors, and how the data is structured and evaluated.
Process
Process
PRECOG evaluates one indicator at a time. The input is a simple table of measured values. The result is a lamp that summarises more than 14 algorithms, together with a longer-term prediction and the details behind it.
PRECOG AI gives more accurate and tailored predictions once it knows the specifics of your project. The example data on this page comes from real-life measurements.
Prediction examples
Short, medium and long-term examples
The charts are real-life examples. In all of them the indicator is of the type lower is better and shows the power consumption of an electric engine.
Long-term prediction: wear caused by friction
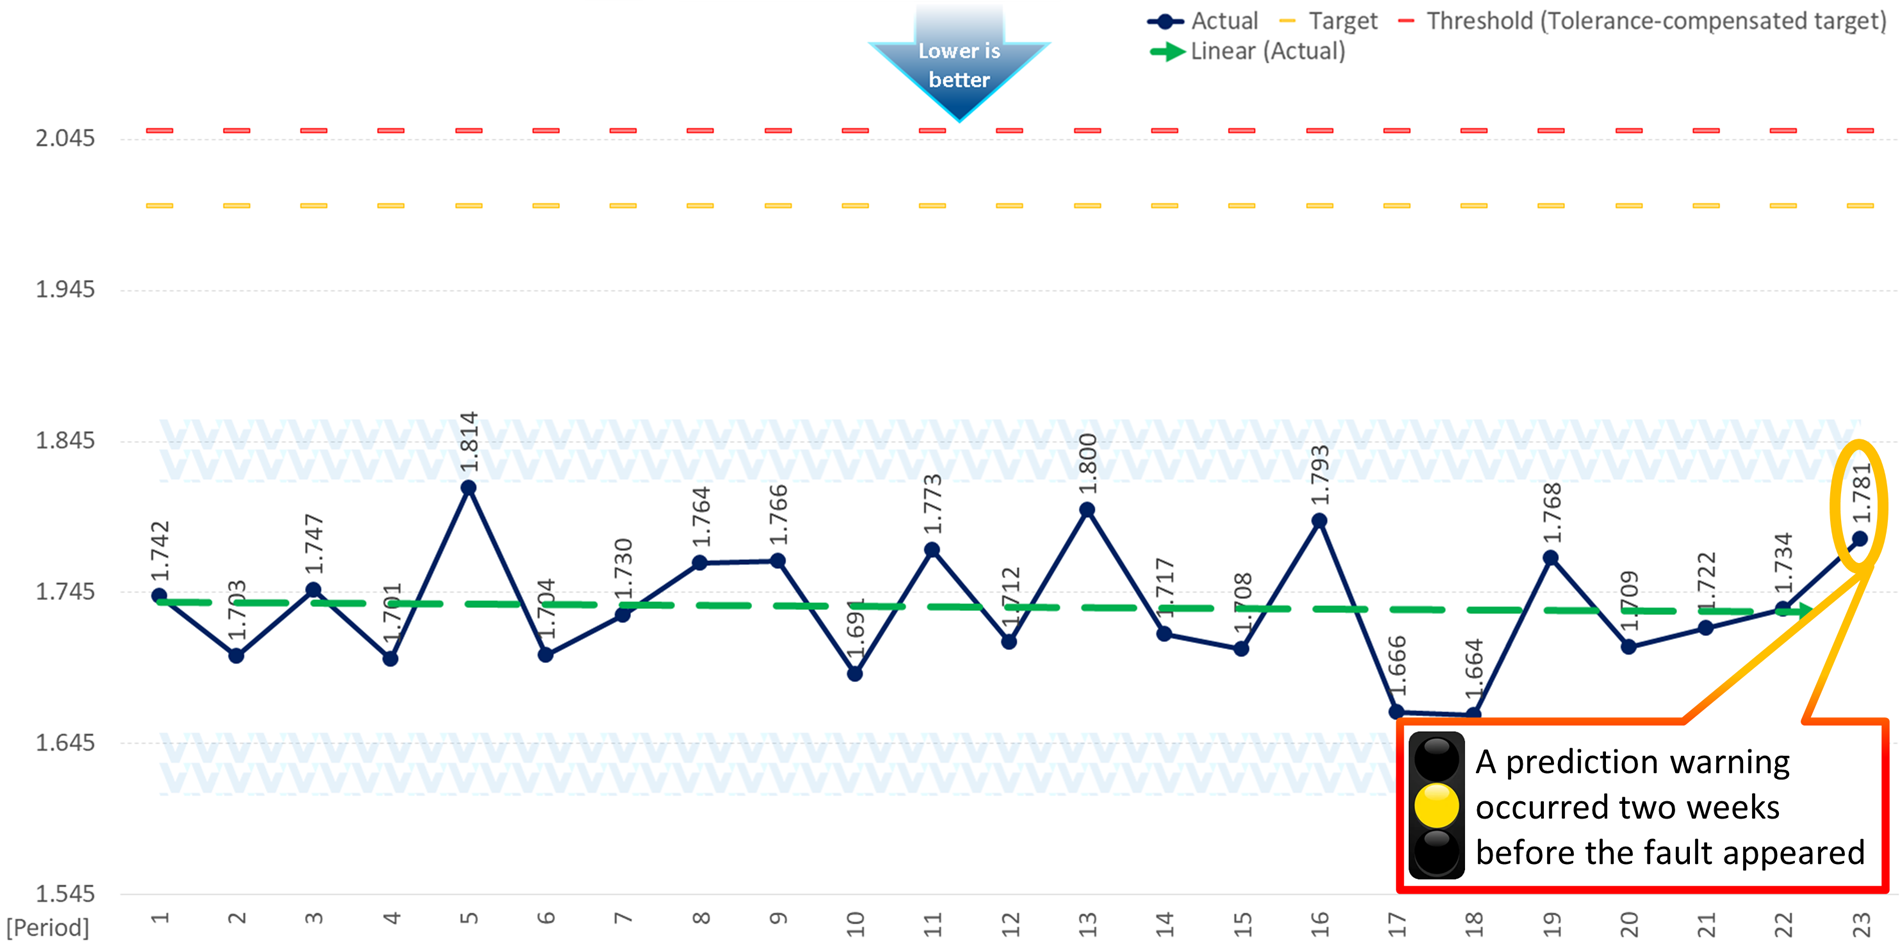

The system warns about wear caused by a friction problem in a complex asset. Based on daily measurements the device runs normally and the linear trendline shows no change. In period 23 an amber warning is issued because PRECOG detected unusual operation.
The first amber warning is followed by further warnings every day. This gives the maintenance staff two weeks to carry out the inspections and to get the required parts. Two weeks later the warnings reach the red level, and on the following day the maintenance staff carry out the repair before any fault can occur. From day 38 the energy consumption is back in the normal range and the warnings disappear. Maintenance and replacement of the faulty components happen without interrupting operation.
Medium-term prediction: a powerful electric motor
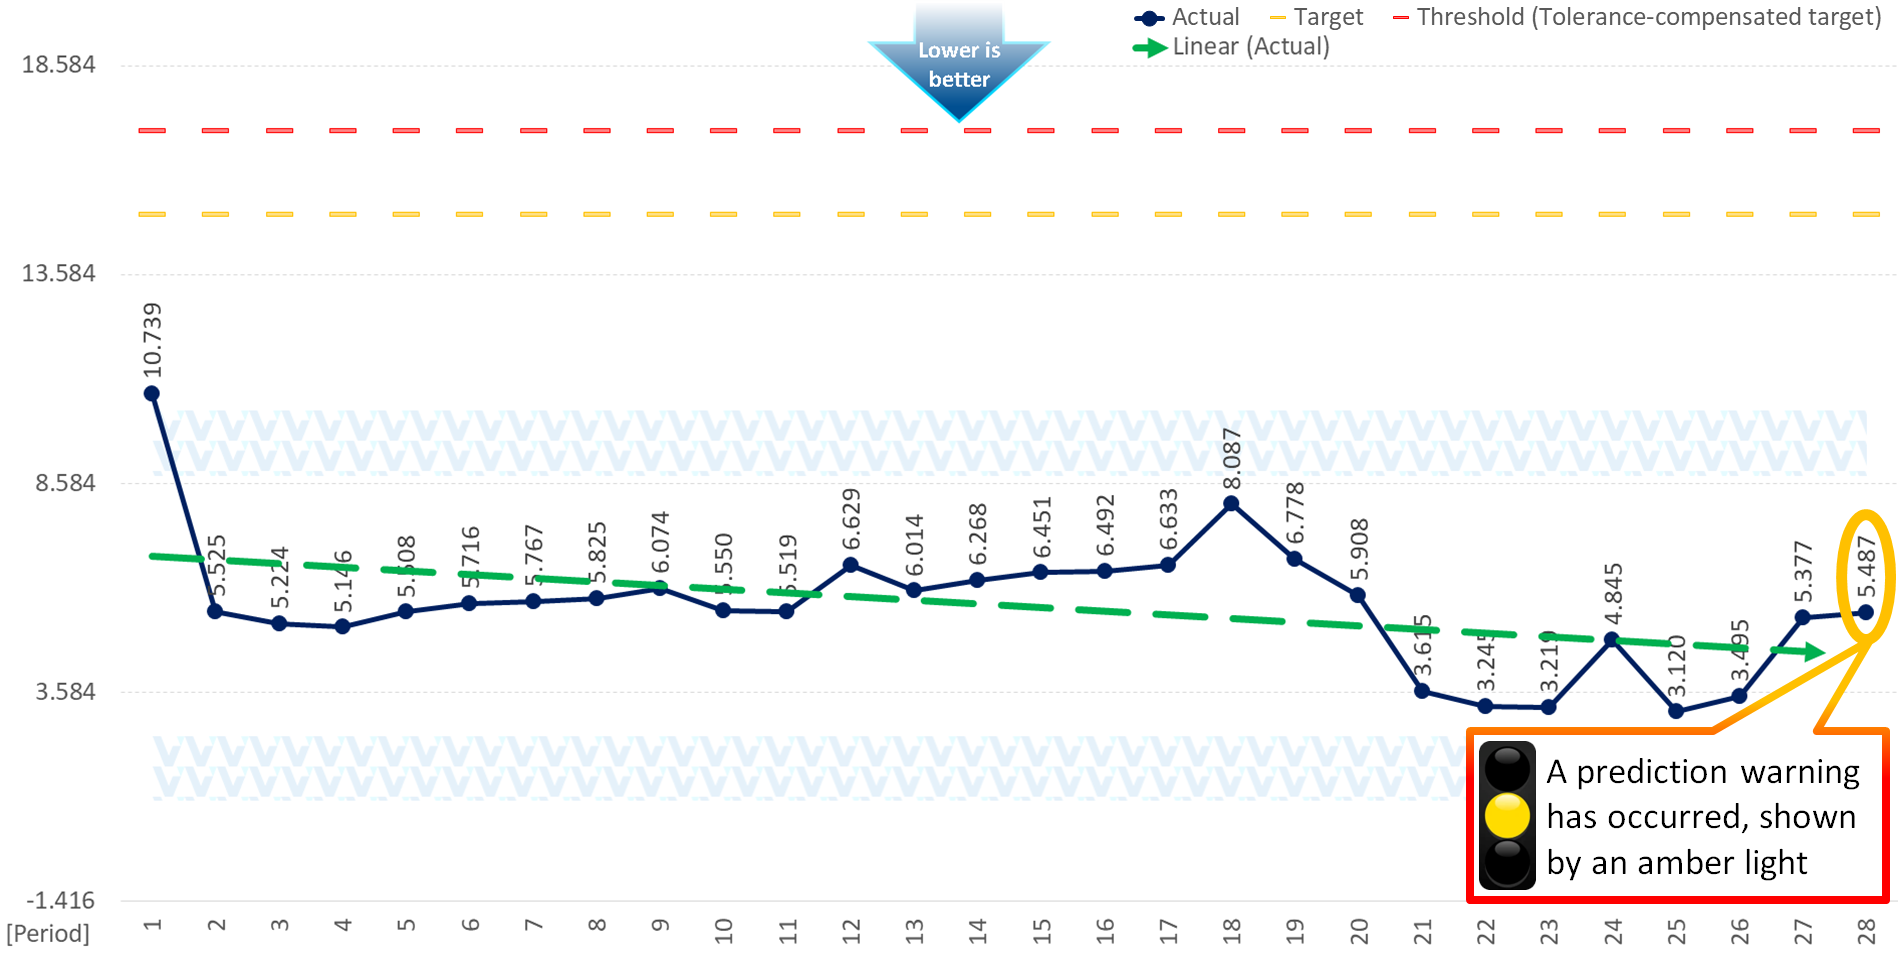

A malfunction in a powerful electric motor. Each data point is the highest power consumption measured within every 4-hour interval. Despite a negative trend, an amber prediction is made. After the first warning, two more amber warnings are issued before the red alert. In the end the power consumption exceeds the target.
Specialists had enough time to prepare the replacement of the critical engine with another device. This prevented downtime and damage to the affected equipment, and operational safety was maintained. After the repair the device could be put back into operation.
Short-term prediction: a suddenly arising fault

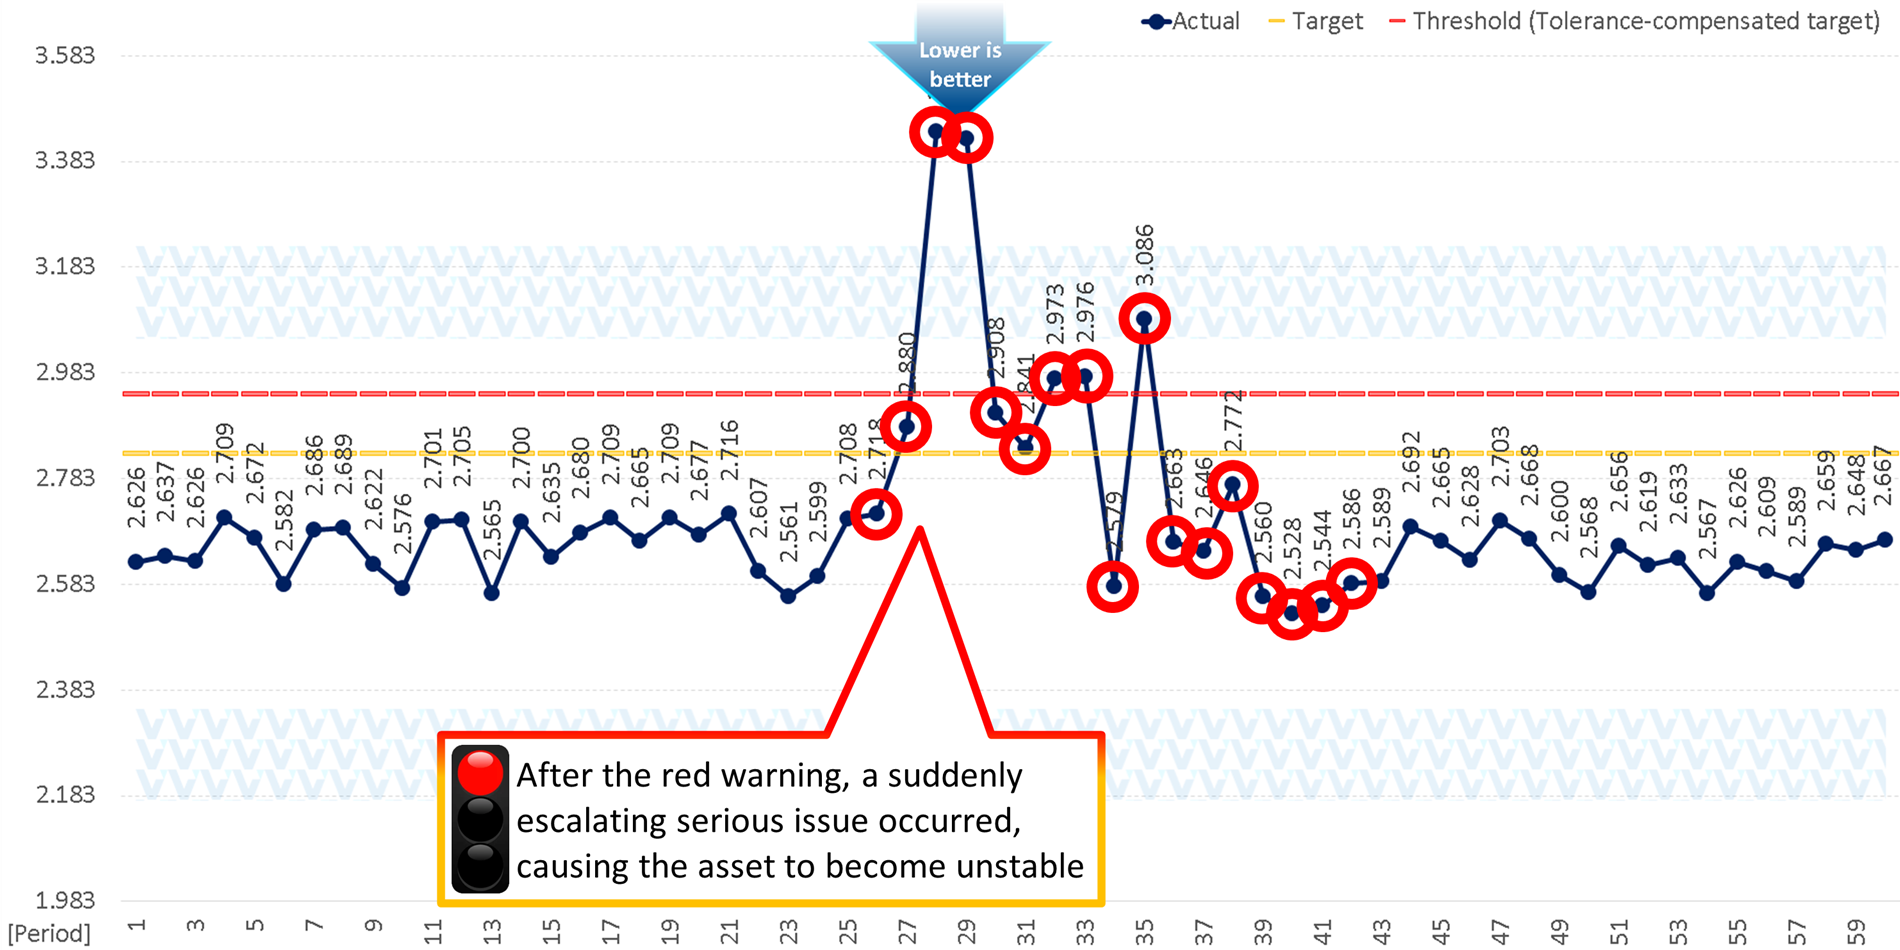
The system detects a serious fault that arises suddenly. The asset was operating in its usual range and the linear trendline showed only a very slight increase. Each data point is the highest power consumption measured within every 2-hour interval. In period 26 a red alert is received.
After the red alert the operator had about 4 hours to find the cause and start the remediation. Shutting the asset down, performing maintenance or switching to a backup system was not possible. Shortly after the repair the system became stable again. The operator could verify this with the support of PRECOG, so no further personal supervision was needed.
Input file
Input file and what the data should contain
The input is a table with the following columns. Each column opens for details.

Period
The timeframe in which the data was collected, arranged from the oldest to the most recent entry. It can be numerical values or date and time stamps. The data can be aggregated to cover longer periods, for example measurements taken every minute can be aggregated into days. Whenever possible, this should be done at the raw data level.
In general, consistent time intervals such as days, hours or minutes are recommended, which can then be aggregated for longer-term analysis. In special cases, such as complex outdoor mechanical assets where the measurements may be noisy and can mask underlying issues, supply as many high-quality reference datasets as possible, ideally at least 10 from any historical period. The last 6 records should also contain the most recent values, measured at consistent intervals or aggregated.
Actual
The measured value of the asset or parameter that is monitored. The input file has to contain at least 6 records.
Target
The maximum or minimum threshold that the physical characteristic should not exceed, depending on the type of indicator. If a higher value is better, the target is the lowest acceptable value. If a lower value is better, the target is the highest allowable value.
If the manufacturer does not specify the target, choose it from test results so that it falls outside the upper and lower intervals marked in blue on the chart. This avoids frequent alerts.
The target can change over the whole period of the data and can affect the prediction. Changes in the target can represent the influence of other physical factors on the asset, such as temperature, rain or other environmental effects. These adjustments are often used for outdoor devices, where seasons and weather conditions may affect the asset.
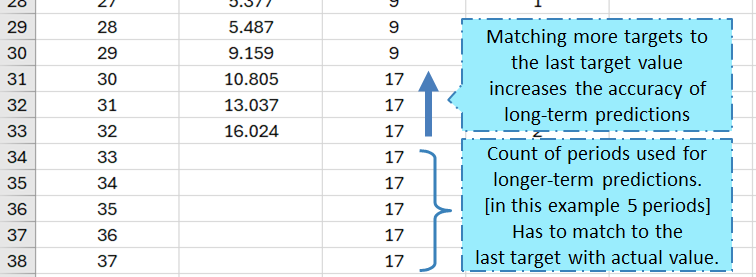
The target column also specifies how many periods are needed for longer-term predictions. This can be done by adding the wanted periods with target values and tolerances but without actual values. The recommendation is 6 to 10 periods. More than 14 periods is not recommended, because the uncertainty grows exponentially and the accuracy drops significantly. Any additional target values must match the target value of the last actual measured value. Going backward through the periods, the more target values match the last one, the more accurate the long-term forecast is.
Tolerance
The permissible deviation from the target value. It is a narrow threshold within which the equipment still operates, but beyond which the operation may cause damage. The tolerance is added to or subtracted from the target, depending on whether the indicator type is higher is better or lower is better.
Higher is better
A binary indicator, TRUE or FALSE, that depends on the nature of the indicator. If a higher value means better performance (also called green, yellow, red or GYR), the column is TRUE. If a lower value means better performance (red, yellow, green or RYG), the column is FALSE.
Review and evaluation of the results

Lamp
The most important result of the analysis is the lamp. It shows the summary result of more than 14 different algorithms, which can predict warnings or indicate critical alerts for the indicator. Further information is in the details section.
Longer-term prediction
The longer-term prediction uses several prediction algorithms to estimate the overall performance probability of an indicator over an extended period. The short-term prediction relies on many algorithms as well, which is why the lamp gives suitable predictions.
The longer-term prediction assesses the probability of an indicator’s performance even if it has not yet been fulfilled. The number of periods can be adjusted with the target that is set. If the probability of meeting the target is below 70%, the risk is high.
Frequently asked questions
How is our solution different from a standard predictive AI solution?
Our AI is trained on more than 7 trillion measurement data points from several industries and rests on 15 years of engineering and mathematical development.
How many records does PRECOG need for a successful evaluation?
At least 6. The maximum is a reasonable number.
We have a target. What does the tolerance do and what is the difference?
The target is, for example, the power output recommended by the manufacturer, or it can be defined during testing. The tolerance is a narrow border where the equipment still works but the operation is harmful. If the target is the limit at which the device gets damaged, the tolerance has to be zero.
My equipment has several data types. How are they evaluated?
The algorithm runs on one data type at a time. The best practice is to run it for each data type. If any of them returns a yellow or red light, the whole evaluation is considered yellow or red. To represent the effect of different physical aspects such as seasons, rain or temperature, the target can be changed. This makes sense mostly for outdoor devices.
How is the period measured: weeks, days, hours, minutes?
You can use whatever data you prefer, as long as it is consistent.
Can I use different time units in one evaluation?
Yes. In general, consistent time intervals such as days, hours or minutes are recommended, which can then be aggregated for longer-term analysis. In special cases, such as complex outdoor mechanical assets where the measurements may be noisy and can mask underlying issues, supply as many high-quality reference datasets as possible, ideally at least 10 from any historical period. The last 6 records should also include the most recent values, measured at consistent intervals or aggregated.
How long does it take until clients benefit from PRECOG?
A project typically takes 2 to 4 months per equipment type. This applies if you start at the lowest maturity level and want to reach the highest. After the roll-out there is a further 2 months of observation and adjustment.
Would you like to talk through your own data?